class: center, middle, inverse, title-slide # Course Introduction ## Advanced Data Science ### Jeff Leek ### 2017-08-24 --- class: center, middle <!-- Welcome to the first lecture of the Advanced Data Science course at the Johns Hopkins Bloomberg School of Public Health! --> <span style="font-size:52px">Preliminaries<span> <!-- As doctor Brian Caffo once said: Pour some science on that data! --> --- # Course Info .pull-left[ - Course name - Instructors - TAs - Course website - Goals - Pre-reqs - Time/Location ] .pull-right[ - Advanced Data Science I/II - Jeff Leek and John Muschelli - Stephen Cristiano - http://jtleek.com/advdatasci - Teach you how to analyze data - R programming/stats methods - M/W 1:30-3:30, W4019 ] <!-- Baseball is a wonderful sport. We will study baseball data in depth in this course. --> --- class: center, middle # Website http://jtleek.com/advdatasci/  --- class: center, middle # Communication https://jhu-advdatasci.slack.com/  --- class: center, middle # Datacamp https://datacamp.com/ 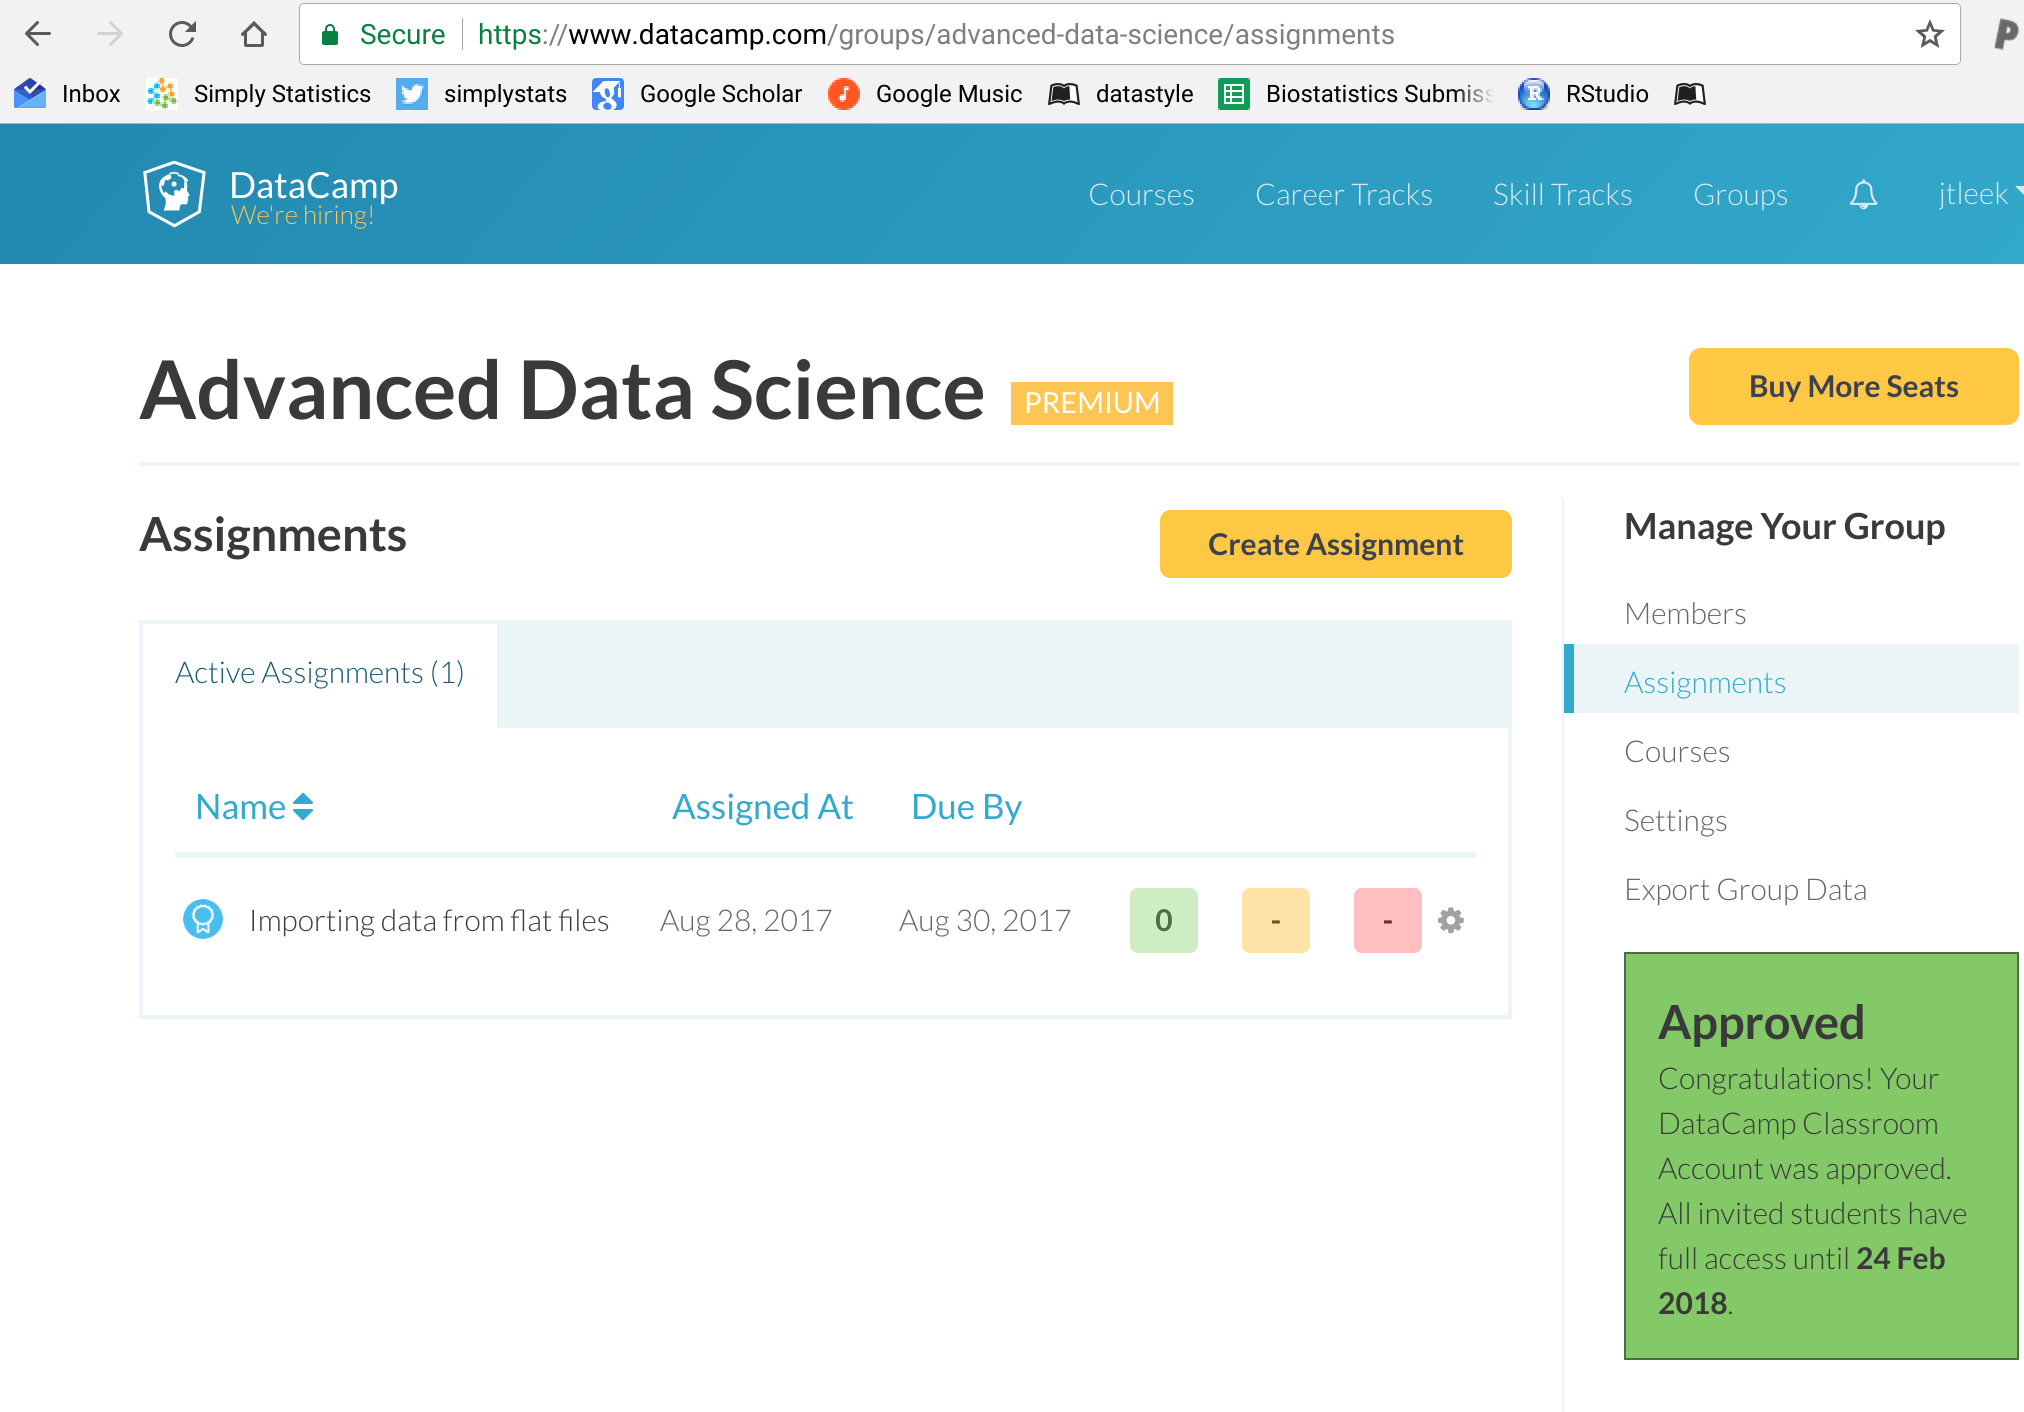 --- class: center, middle # Github https://github.com/  --- class: center, middle <span style="font-size:52px">About me<span> <!-- As doctor Brian Caffo once said: Pour some science on that data! --> --- class: center, middle <!-- Here's a fullscreen image. -->  --- class: center, middle  --- class: center, middle  --- class: center, middle  --- class: center, middle  --- class: center, middle <span style="font-size:52px">About you<span> --- class: center, middle <span style="font-size:52px">https://goo.gl/x8Ekx1<span> --- class: middle ```r library(gplots) library(googlesheets) my_url = "https://docs.google.com/spreadsheets/d/e/2PACX-1vT_ezPG2GgOg8xDwfK1Bcn6cJwanDJjWE6Vz0Gb-ffeJLj3yWKWoVZF7sRCiAsSX-m1-2ycsg-ZKl_6/pubhtml" my_gs = gs_url(my_url) dat = gs_read(my_gs) library(RSkittleBrewer) trop = RSkittleBrewer("tropical") colramp = colorRampPalette(c(trop[3],"white",trop[2]))(9) palette(trop) dat = as.matrix(dat) dat[is.na(dat)]= 0 par(mar=c(5,5,5,5)) heatmap.2(as.matrix(dat),col=colramp,Rowv=NA,Colv=NA, dendrogram="none", scale="none", trace="none",margins=c(10,2)) ``` <!-- Here's a plot. --> --- # It is not the critic who counts .pull-left[ "It is not the critic who counts: not the man who points out how the strong man stumbles or where the doer of deeds could have done better. The credit belongs to the man who is actually in the arena, whose face is marred by dust and sweat and blood, who strives valiantly, who errs and comes up short again and again, because there is no effort without error or shortcoming, but who knows the great enthusiasms, the great devotions, who spends himself for a worthy cause; who, at the best, knows, in the end, the triumph of high achievement, and who, at the worst, if he fails, at least he fails while daring greatly, so that his place shall never be with those cold and timid souls who knew neither victory nor defeat." ] .pull-right[  ] --- class: center, middle  --- class: center, middle  --- class: center, middle  --- class: center, middle  --- class: center, middle  --- class: center, middle  --- class: center, middle  --- class: center, middle  --- class: center, middle  --- class: center, middle  --- class: center, middle  --- class: center, middle  --- class: center, middle  https://www.pwc.com/us/en/publications/data-science-and-analytics.html --- class: center, middle <span style="font-size:52px">What is data science?<span> --- # The key problem in data science .pull-left[ "Ask yourselves, what problem have you solved, ever, that was worth solving, where you knew knew all of the given information in advance? Where you didn’t have a surplus of information and have to filter it out, or you didn’t have insufficient information and have to go find some?" ] .pull-right[  ] https://www.ted.com/talks/dan_meyer_math_curriculum_makeover --- # Defining data science .pull-left[ "Data science is the process of formulating a quantitative question that can be answered with data, collecting and cleaning the data, analyzing the data, and communicating the answer to the question to a relevant audience." ] .pull-right[  ] https://simplystatistics.org/2015/03/17/data-science-done-well-looks-easy-and-that-is-a-big-problem-for-data-scientists/ --- # Data science by any other name... * __Advanced analytics__ - using data to inform business decisions * __Biostatistics__ - using data to inform health decisions * __Natural language processing__ - using data to understand language * __Econometrics__ - using data to understand the economic climate * __Signal processing__ - using data to understand electronic signals * __Data journalism__ - using data for reporting. Data science - a general purpose term applied to the above --- class: center, middle <span style="font-size:52px">The data science process<span> --- # Structure of a data analysis * Define the question * Define the ideal data set * Determine what data you can access * Obtain the data * Clean the data * Exploratory data analysis * Statistical prediction/modeling * Interpret results * Challenge results * Synthesize/write up results * Create reproducible code --- # An example * __Start with a general question:__ * Can I automatically detect emails that are SPAM that are not? * __Make it concrete:__ * Can I use quantitative characteristics of the emails to classify them as SPAM/HAM? --- class: center, middle http://science.sciencemag.org/content/347/6228/1314  --- # Data may depend on your goal * Descriptive - a whole population * Exploratory - a random sample with many variables measured * Inferential - the right population, randomly sampled * Predictive - a training and test data set from the same population * Causal - data from a randomized study * Mechanistic - data about all components of the system --- class: center, middle <span style="font-size:52px">Activity: guess the question type<span> --- class: center, middle www.netflix.com  --- class: center, middle https://goo.gl/WheVuJ  --- class: center, middle https://goo.gl/ZRdPcg  --- class: center, middle # Back to our example https://www.google.com/about/datacenters/  --- class: center, middle # Raw data to covariates  --- # Types of "data" * __Text files__ -> frequency of words, frequency of phrases * __Images__ -> edges, corners, blobs, ridges * __Webpages__ -> number and type of images, position of elements * __People__ -> height, weight, hair color, number of steps etc. *__Automated:__ Starting to be better for things like images/videos/text with large training sets. * __Manual:__ Until recently the best approach in almost all cases --- # Obtain the raw data * Sometimes you can find data free on the web * Other times you may need to buy the data * Be sure to respect the terms of use * If the data don't exist, you may need to generate it yourself * Polite emails go a long way * If you will load the data from an internet source, record the url and time accessed --- class: center, middle # Raw data to covariates  --- class: center, middle # A possible solution  --- # Cleaning the data * Raw data often needs to be processed * If it is pre-processed, make sure you understand how * Understand the source of the data (census, sample, convenience sample, etc.) * May need reformating, subsampling - record these steps * __Determine if the data are good enough__ - if not, quit or change data --- # A critical function .pull-left[ "The combination of some data and an aching desire for an answer does not ensure that a reasonable answer can be extracted from a given body of data" ] .pull-right[  ] --- # Look at the data ```r library(kernlab) data(spam) library(dplyr) glimpse(spam) ``` ``` ## Observations: 4,601 ## Variables: 58 ## $ make <dbl> 0.00, 0.21, 0.06, 0.00, 0.00, 0.00, 0.00, 0.... ## $ address <dbl> 0.64, 0.28, 0.00, 0.00, 0.00, 0.00, 0.00, 0.... ## $ all <dbl> 0.64, 0.50, 0.71, 0.00, 0.00, 0.00, 0.00, 0.... ## $ num3d <dbl> 0, 0, 0, 0, 0, 0, 0, 0, 0, 0, 0, 0, 0, 0, 0,... ## $ our <dbl> 0.32, 0.14, 1.23, 0.63, 0.63, 1.85, 1.92, 1.... ## $ over <dbl> 0.00, 0.28, 0.19, 0.00, 0.00, 0.00, 0.00, 0.... ## $ remove <dbl> 0.00, 0.21, 0.19, 0.31, 0.31, 0.00, 0.00, 0.... ## $ internet <dbl> 0.00, 0.07, 0.12, 0.63, 0.63, 1.85, 0.00, 1.... ## $ order <dbl> 0.00, 0.00, 0.64, 0.31, 0.31, 0.00, 0.00, 0.... ## $ mail <dbl> 0.00, 0.94, 0.25, 0.63, 0.63, 0.00, 0.64, 0.... ## $ receive <dbl> 0.00, 0.21, 0.38, 0.31, 0.31, 0.00, 0.96, 0.... ## $ will <dbl> 0.64, 0.79, 0.45, 0.31, 0.31, 0.00, 1.28, 0.... ## $ people <dbl> 0.00, 0.65, 0.12, 0.31, 0.31, 0.00, 0.00, 0.... ## $ report <dbl> 0.00, 0.21, 0.00, 0.00, 0.00, 0.00, 0.00, 0.... ## $ addresses <dbl> 0.00, 0.14, 1.75, 0.00, 0.00, 0.00, 0.00, 0.... ## $ free <dbl> 0.32, 0.14, 0.06, 0.31, 0.31, 0.00, 0.96, 0.... ## $ business <dbl> 0.00, 0.07, 0.06, 0.00, 0.00, 0.00, 0.00, 0.... ## $ email <dbl> 1.29, 0.28, 1.03, 0.00, 0.00, 0.00, 0.32, 0.... ## $ you <dbl> 1.93, 3.47, 1.36, 3.18, 3.18, 0.00, 3.85, 0.... ## $ credit <dbl> 0.00, 0.00, 0.32, 0.00, 0.00, 0.00, 0.00, 0.... ## $ your <dbl> 0.96, 1.59, 0.51, 0.31, 0.31, 0.00, 0.64, 0.... ## $ font <dbl> 0, 0, 0, 0, 0, 0, 0, 0, 0, 0, 0, 0, 0, 0, 0,... ## $ num000 <dbl> 0.00, 0.43, 1.16, 0.00, 0.00, 0.00, 0.00, 0.... ## $ money <dbl> 0.00, 0.43, 0.06, 0.00, 0.00, 0.00, 0.00, 0.... ## $ hp <dbl> 0, 0, 0, 0, 0, 0, 0, 0, 0, 0, 0, 0, 0, 0, 0,... ## $ hpl <dbl> 0, 0, 0, 0, 0, 0, 0, 0, 0, 0, 0, 0, 0, 0, 0,... ## $ george <dbl> 0, 0, 0, 0, 0, 0, 0, 0, 0, 0, 0, 0, 0, 0, 0,... ## $ num650 <dbl> 0.00, 0.00, 0.00, 0.00, 0.00, 0.00, 0.00, 0.... ## $ lab <dbl> 0, 0, 0, 0, 0, 0, 0, 0, 0, 0, 0, 0, 0, 0, 0,... ## $ labs <dbl> 0, 0, 0, 0, 0, 0, 0, 0, 0, 0, 0, 0, 0, 0, 0,... ## $ telnet <dbl> 0, 0, 0, 0, 0, 0, 0, 0, 0, 0, 0, 0, 0, 0, 0,... ## $ num857 <dbl> 0, 0, 0, 0, 0, 0, 0, 0, 0, 0, 0, 0, 0, 0, 0,... ## $ data <dbl> 0.00, 0.00, 0.00, 0.00, 0.00, 0.00, 0.00, 0.... ## $ num415 <dbl> 0, 0, 0, 0, 0, 0, 0, 0, 0, 0, 0, 0, 0, 0, 0,... ## $ num85 <dbl> 0, 0, 0, 0, 0, 0, 0, 0, 0, 0, 0, 0, 0, 0, 0,... ## $ technology <dbl> 0.00, 0.00, 0.00, 0.00, 0.00, 0.00, 0.00, 0.... ## $ num1999 <dbl> 0.00, 0.07, 0.00, 0.00, 0.00, 0.00, 0.00, 0.... ## $ parts <dbl> 0, 0, 0, 0, 0, 0, 0, 0, 0, 0, 0, 0, 0, 0, 0,... ## $ pm <dbl> 0, 0, 0, 0, 0, 0, 0, 0, 0, 0, 0, 0, 0, 0, 0,... ## $ direct <dbl> 0.00, 0.00, 0.06, 0.00, 0.00, 0.00, 0.00, 0.... ## $ cs <dbl> 0, 0, 0, 0, 0, 0, 0, 0, 0, 0, 0, 0, 0, 0, 0,... ## $ meeting <dbl> 0, 0, 0, 0, 0, 0, 0, 0, 0, 0, 0, 0, 0, 0, 0,... ## $ original <dbl> 0.00, 0.00, 0.12, 0.00, 0.00, 0.00, 0.00, 0.... ## $ project <dbl> 0.00, 0.00, 0.00, 0.00, 0.00, 0.00, 0.00, 0.... ## $ re <dbl> 0.00, 0.00, 0.06, 0.00, 0.00, 0.00, 0.00, 0.... ## $ edu <dbl> 0.00, 0.00, 0.06, 0.00, 0.00, 0.00, 0.00, 0.... ## $ table <dbl> 0, 0, 0, 0, 0, 0, 0, 0, 0, 0, 0, 0, 0, 0, 0,... ## $ conference <dbl> 0, 0, 0, 0, 0, 0, 0, 0, 0, 0, 0, 0, 0, 0, 0,... ## $ charSemicolon <dbl> 0.000, 0.000, 0.010, 0.000, 0.000, 0.000, 0.... ## $ charRoundbracket <dbl> 0.000, 0.132, 0.143, 0.137, 0.135, 0.223, 0.... ## $ charSquarebracket <dbl> 0.000, 0.000, 0.000, 0.000, 0.000, 0.000, 0.... ## $ charExclamation <dbl> 0.778, 0.372, 0.276, 0.137, 0.135, 0.000, 0.... ## $ charDollar <dbl> 0.000, 0.180, 0.184, 0.000, 0.000, 0.000, 0.... ## $ charHash <dbl> 0.000, 0.048, 0.010, 0.000, 0.000, 0.000, 0.... ## $ capitalAve <dbl> 3.756, 5.114, 9.821, 3.537, 3.537, 3.000, 1.... ## $ capitalLong <dbl> 61, 101, 485, 40, 40, 15, 4, 11, 445, 43, 6,... ## $ capitalTotal <dbl> 278, 1028, 2259, 191, 191, 54, 112, 49, 1257... ## $ type <fctr> spam, spam, spam, spam, spam, spam, spam, s... ``` --- # Split into training and text ```r set.seed(123) training = rbinom(4601,size=1,prob=0.5) table(training) ``` ``` ## training ## 0 1 ## 2318 2283 ``` ```r train_spam = spam[training==1,] test_spam = spam[training==0,] ``` --- # Exploratory analysis ```r plot(log10(train_spam$capitalAve + 1) ~ train_spam$type) ``` <!-- --> --- # EDA informs modeling ```r hc1 = hclust(dist(t(log10(train_spam[,1:55]+1)))) plot(hc1) ``` <!-- --> --- # Modeling ```r train_spam$numType = as.numeric(train_spam$type) - 1 cost_func = function(x, y) sum(x!=(y > 0.5)) cv_error = rep(NA, 55) library(boot) for(i in 1:55){ lm_formula = reformulate(names(train_spam)[i], response = "numType") glm_fit = glm(lm_formula, family = "binomial", data = train_spam) cv_error[i] = cv.glm(train_spam, glm_fit, cost_func, 2)$delta[2] } # Which predictor has minimum cross-validated error? names(train_spam)[which.min(cv_error)] ``` ``` ## [1] "charDollar" ``` --- # Get a measure of uncertainty ```r ## Fit the model with the best predictor pred_mod = glm(numType ~ charDollar,family="binomial",data=train_spam) ## Get predictions on the test set pred_test = predict(pred_mod,test_spam) pred_spam = rep("nonspam",dim(test_spam)[1]) ## Classify as `spam' for those with prob > 0.5 pred_spam[pred_mod$fitted > 0.5] = "spam" table(pred_spam,test_spam$type) ``` ``` ## ## pred_spam nonspam spam ## nonspam 1339 450 ## spam 66 463 ``` ```r mean(pred_spam==test_spam$type) ``` ``` ## [1] 0.7773943 ``` --- # Interpret the results * Use the appropriate language * describes * correlates with/associated with * leads to/causes * predicts * Give an explanation * Interpret coefficients * Interpret measures of uncertainty --- # Our example * The fraction of characters that are dollar signs can be used to predict if an email is Spam * Anything with more than 6.6% dollar signs is classified as Spam * More dollar signs always means more Spam under our prediction * Our test set error rate was 22.4% --- # Summarize the results * Lead with the question * Summarize the analyses into the story * Don't include every analysis, include it * If it is needed for the story * If it is needed to address a challenge * Order analyses according to the story, rather than chronologically * Include "pretty" figures that contribute to the story --- # In our example * Lead with the question * Can I use quantitative characteristics of the emails to classify them as SPAM/HAM? * Describe the approach * Collected data from UCI -> created training/test sets * Explored relationships * Choose logistic model on training set by cross validation * Applied to test, 78\% test set accuracy * Interpret results * Number of dollar signs seems reasonable, e.g. "Make money with Viagra $ $ $ $!" * Challenge results * 78% isn't that great * I could use more variables * Why logistic regression? --- class: center, middle # Make your code reproducible  --- # Structure of a data analysis * Define the question * Define the ideal data set * Determine what data you can access * Obtain the data * Clean the data * Exploratory data analysis * Statistical prediction/modeling * Interpret results * Challenge results * Synthesize/write up results * Create reproducible code