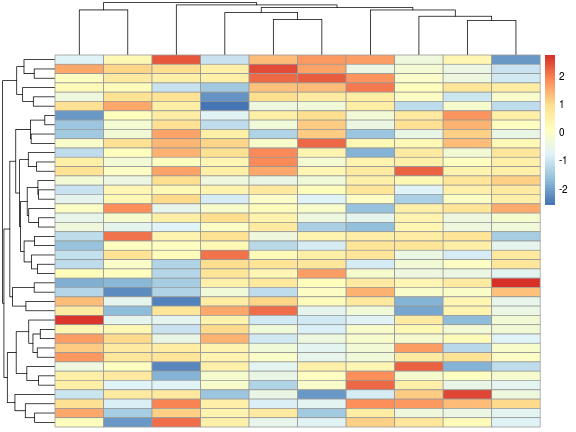
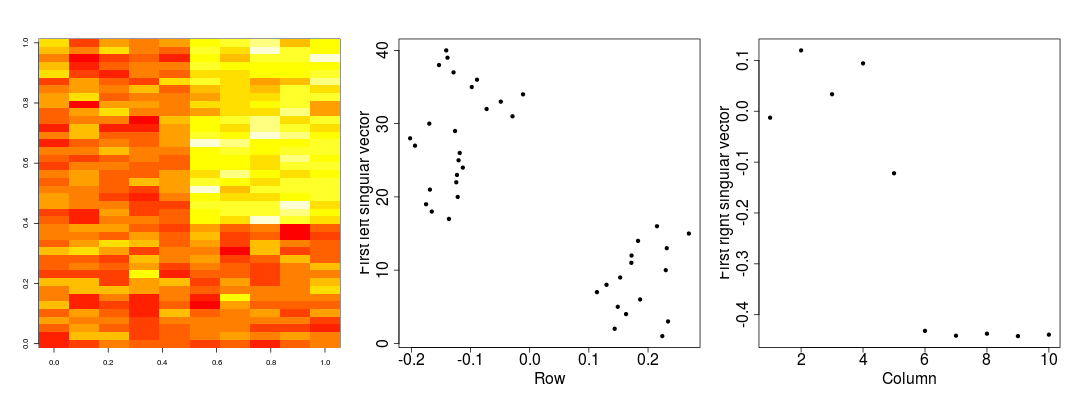
class: center, middle, inverse, title-slide # Dimension Reduction ## JHU Data Science ### www.jtleek.com/advdatasci --- class: inverse, middle, center # Dimension Reduction ≈ compression of data --- class: inverse background-image: url(../imgs/dim_red//pagerank.png) background-size: 70% background-position: center .footnote[http://ilpubs.stanford.edu:8090/422/1/1999-66.pdf] --- class: inverse background-image: url(../imgs/dim_red//genome_svd.png) background-size: 70% background-position: center .footnote[http://www.pnas.org/content/97/18/10101.full] --- class: inverse background-image: url(../imgs/dim_red//genome_svd2.png) background-size: 60% background-position: center .footnote[http://www.nature.com/ng/journal/v38/n8/full/ng1847.html] --- class: inverse ## Matrix Data ```r dataMatrix <- matrix(rnorm(400), nrow = 40) image(1:10, 1:40, t(dataMatrix)[, nrow(dataMatrix):1]) ``` <!-- --> --- class: inverse ## Matrix Data ```r pheatmap::pheatmap(dataMatrix) ``` <!-- --> --- class: inverse ## Matrix Data: add a pattern ```r set.seed(678910) for(i in 1:40){ # flip a coin coinFlip <- rbinom(1,size=1,prob=0.5) # if coin is heads add a common pattern to that row if(coinFlip){ dataMatrix[i,] <- dataMatrix[i,] + rep(c(0,3),each=5) } } ``` --- class: inverse ## Matrix Data: add a pattern ```r pheatmap(dataMatrix,cluster_rows=FALSE,cluster_cols=FALSE) ``` <!-- --> --- class: inverse ## Matrix Data: add a pattern ```r pheatmap(dataMatrix) ``` <!-- --> --- class: inverse ## Row and column patterns ```r hh <- hclust(dist(dataMatrix)); dataMatrixOrdered <- dataMatrix[hh$order,]; par(mfrow=c(1,3)) pal = colorRampPalette(rev(brewer.pal(n = 7, name = "RdYlBu")))(100) image(t(dataMatrixOrdered)[, nrow(dataMatrixOrdered):1], col = pal) plot(rowMeans(dataMatrixOrdered), 40:1, xlab="Row Mean", ylab="Row", pch=19) plot(colMeans(dataMatrixOrdered), xlab="Column", ylab="Column Mean", pch=19) ``` <!-- --> --- class: inverse ## A simple plotting function (for mildly-better plots) ```r myplot = function(x, y, type = "p", ...) { if (missing(y)) { plot(x, ..., type = type, cex.axis = 2, cex.lab = 2, pch = 19) } else { plot(x, y, ..., type = type, cex.axis = 2, cex.lab = 2, pch = 19) }} ``` <!-- --> --- class: inverse ## Related problems .super[ You have multivariate variables `\(X_{1},...,X_{n}\)` * Find a new set of multivariate variables that are uncorrelated and explain as much variance as possible. <br><br> * If you put all the variables together in one matrix, find the best matrix created with fewer variables (lower rank) that explains the original data. The first goal is statistical and the second goal is data compression. ] --- class: inverse ## Related solutions .super[ SVD * If X is a matrix with each variable in a column and each observation in a row then the SVD is a "matrix decomposition" $$ X = UDV^{T} $$ where the columns of U are orthogonal (left singular vectors), the columns of V are orthogonal (right singular vectors) and D is a diagonal matrix (singular values). PCA * The principal components are equal to the right singular values if you first scale (subtract the mean, divide by the standard deviation) the variables. ] --- class: inverse background-image: url(../imgs/dim_red//pca_math.png) background-size: 70% background-position: center # PCA --- class: inverse background-image: url(../imgs/dim_red//pca_twovar.png) background-size: 45% background-position: bottom # PCA with two variables --- class: inverse ## Example in two dimensions ```r x = rnorm(100); y = rnorm(100, mean=x);dat = cbind(x,y); pca1 = prcomp(dat) ``` <!-- --> --- class: inverse background-image: url(../imgs/dim_red//svd_math.png) background-size: 80% background-position: center # SVD math! --- class: inverse background-image: url(../imgs/dim_red//svd_qr.png) background-size: 80% background-position: center # SVD best q rank approximation --- class: inverse background-image: url(../imgs/dim_red//svd_math2.png) background-size: 70% background-position: center # More facts... --- class: inverse background-image: url(../imgs/dim_red//svd_picture.png) background-size: 70% background-position: center # SVD in pictures .footnote[https://dl.dropboxusercontent.com/u/7710864/jhsph753/lectures/vadim.pdf] --- class: inverse background-image: url(../imgs/dim_red//svd_cat.png) background-size: 90% background-position: center # SVD and residuals --- class: inverse background-image: url(../imgs/dim_red//svd_compression.png) background-size: 80% background-position: center # SVD compression .footnote[https://dl.dropboxusercontent.com/u/7710864/jhsph753/lectures/vadim.pdf] --- class: inverse background-image: url(../imgs/dim_red//svd_covar.png) background-size: 80% background-position: center # An important fact --- class: inverse background-image: url(../imgs/dim_red//svd_genome3.png) background-size: 55% background-position: bottom # A widely used trick --- class: inverse ## Back to our example ```r svd1 <- svd(scale(dataMatrixOrdered)) image(t(dataMatrixOrdered)[,nrow(dataMatrixOrdered):1]) myplot(svd1$u[,1],40:1,,xlab="Row",ylab="First left singular vector") myplot(svd1$v[,1],xlab="Column",ylab="First right singular vector") ``` <!-- --> --- class: inverse ## Components of SVD - variance explained ```r par(mfrow=c(1,2)) myplot(svd1$d,xlab="Column",ylab="Singular value") myplot(svd1$d^2/sum(svd1$d^2),xlab="Column",ylab="Prop. of variance explained") ``` <!-- --> --- class: inverse ## Relationship to PCs ```r svd1 <- svd(scale(dataMatrixOrdered)); pca1 <- prcomp(dataMatrixOrdered,scale=TRUE) myplot(pca1$rotation[,1],svd1$v[,1], xlab="Principal Component 1",ylab="Right Singular Vector 1") abline(c(0,1)) ``` <!-- --> --- class: inverse ## Back to variance explained ```r constantMatrix <- dataMatrixOrdered*0 for(i in 1:nrow(dataMatrixOrdered)) constantMatrix[i,] <- rep(c(0,1),each=5) svd1 <- svd(constantMatrix) ``` <!-- --> --- class: inverse ## What if we add a second pattern? ```r set.seed(678910) for(i in 1:40){ # flip a coin coinFlip1 <- rbinom(1,size=1,prob=0.5) coinFlip2 <- rbinom(1,size=1,prob=0.5) # if coin is heads add a common pattern to that row if(coinFlip1){ dataMatrix[i,] <- dataMatrix[i,] + rep(c(0,5),each=5) } if(coinFlip2){ dataMatrix[i,] <- dataMatrix[i,] + rep(c(0,5),5) } } hh <- hclust(dist(dataMatrix)); dataMatrixOrdered <- dataMatrix[hh$order,] ``` --- class: inverse ## What if we add a second pattern? ```r svd2 <- svd(scale(dataMatrixOrdered)) par(mfrow=c(1,3)) image(t(dataMatrixOrdered)[,nrow(dataMatrixOrdered):1],col=pal) myplot(rep(c(0,1),each=5),xlab="Column",ylab="Pattern 1") myplot(rep(c(0,1),5),xlab="Column",ylab="Pattern 2") ``` <!-- --> --- class: inverse ## v and row patterns ```r par(mfrow=c(1,3)) image(t(dataMatrixOrdered)[,nrow(dataMatrixOrdered):1],col=pal) plot(svd2$v[,1],xlab="Column",ylab="First right singular vector") plot(svd2$v[,2],xlab="Column",ylab="Second right singular vector") ``` <!-- --> --- class: inverse ## A pathological case ```r dataMatrix <- matrix(rnorm(400),nrow=40); dataMatrix[1,] = 50*rep(c(0,1),each=5) ss = svd(dataMatrix - rowMeans(dataMatrix)) ``` .left-column-equal[ ```r myplot(ss$v[,1]); ``` <!-- --> ] .right-column-equal[ ```r pheatmap(dataMatrix) ``` <!-- --> ] --- class: inverse ## Missing values ```r dataMatrix2 <- dataMatrixOrdered ## Randomly insert some missing data dataMatrix2[sample(1:100,size=40,replace=FALSE)] <- NA # fails because scale doesn't like missing data! # svd_miss <- svd(scale(dataMatrix2)) ``` --- class: inverse ## Missing values ```r library(impute) ## Available from http://bioconductor.org data_imputed <- impute.knn(dataMatrix2)$data svd_non_miss <- svd(scale(data_imputed)); svd_full <- svd(scale(dataMatrixOrdered)) ``` <!-- --> --- class: inverse background-image: url(../imgs/dim_red//digits.png) background-size: 50% background-position: center # Digits example .footnote[http://statweb.stanford.edu/~tibs/ElemStatLearn/] --- class: inverse background-image: url(../imgs/dim_red//threes.png) background-size: 70% background-position: center # Validation in threes .footnote[http://statweb.stanford.edu/~tibs/ElemStatLearn/] --- class: inverse background-image: url(../imgs/dim_red//pagerank2.png) background-size: 70% background-position: center # Pagerank .footnote[http://statweb.stanford.edu/~tibs/ElemStatLearn/] --- class: inverse background-image: url(../imgs/dim_red//pagerank_math.png) background-size: 70% background-position: center # Random surfer model --- class: inverse background-image: url(../imgs/dim_red//pagerank_eigen.png) background-size: 65% background-position: center # Pagerank as eigenvector problem --- class: inverse background-image: url(../imgs/dim_red//pagerank_binary.png) background-size: 80% background-position: center # Example --- class: inverse ## Calculate Page Ranks ```r L = matrix( c(0, 0, 1, 0, 1, 0, 0, 0, 1, 1, 0, 1, 0, 0, 0, 0), byrow = TRUE, nrow = 4) cc = colSums(L) d = 0.85 e = rep(1, 4) N = 4 A = (1 - d) * e %*% t(e) + d * L %*% solve(diag(cc)) Re(eigen(A)$values) ``` ``` [1] 1.450000e+00 -4.250000e-01 -4.250000e-01 -1.234286e-17 ``` ```r phat = Re(eigen(A)$vectors[1,]) phat = (N * phat / c( t(e) %*% phat)) phat ``` ``` [1] 1.184648e+00 1.407676e+00 1.407676e+00 -3.237299e-16 ``` --- class: inverse # An example of interpretable pcs --- class: inverse background-image: url(../imgs/dim_red//genes-geography.png) background-size: 80% background-position: center # Genetics PCs --- class: inverse ## Dimension Reduction .super[ - PCA is a highly-useful (and used tool) <br><br> - Many use variance explained threshold for dimension reduction <br><br> - Also an orthogonalizing tool <br><br> - Maximum Rank of matrix X is always `\(\min(n, p)\)` <br><br> - Use the lower-dimensional matrix for big data <br><br> ]